
open source multimodal data IDE


Give your data files an intuitive, visual sense
Plug and play
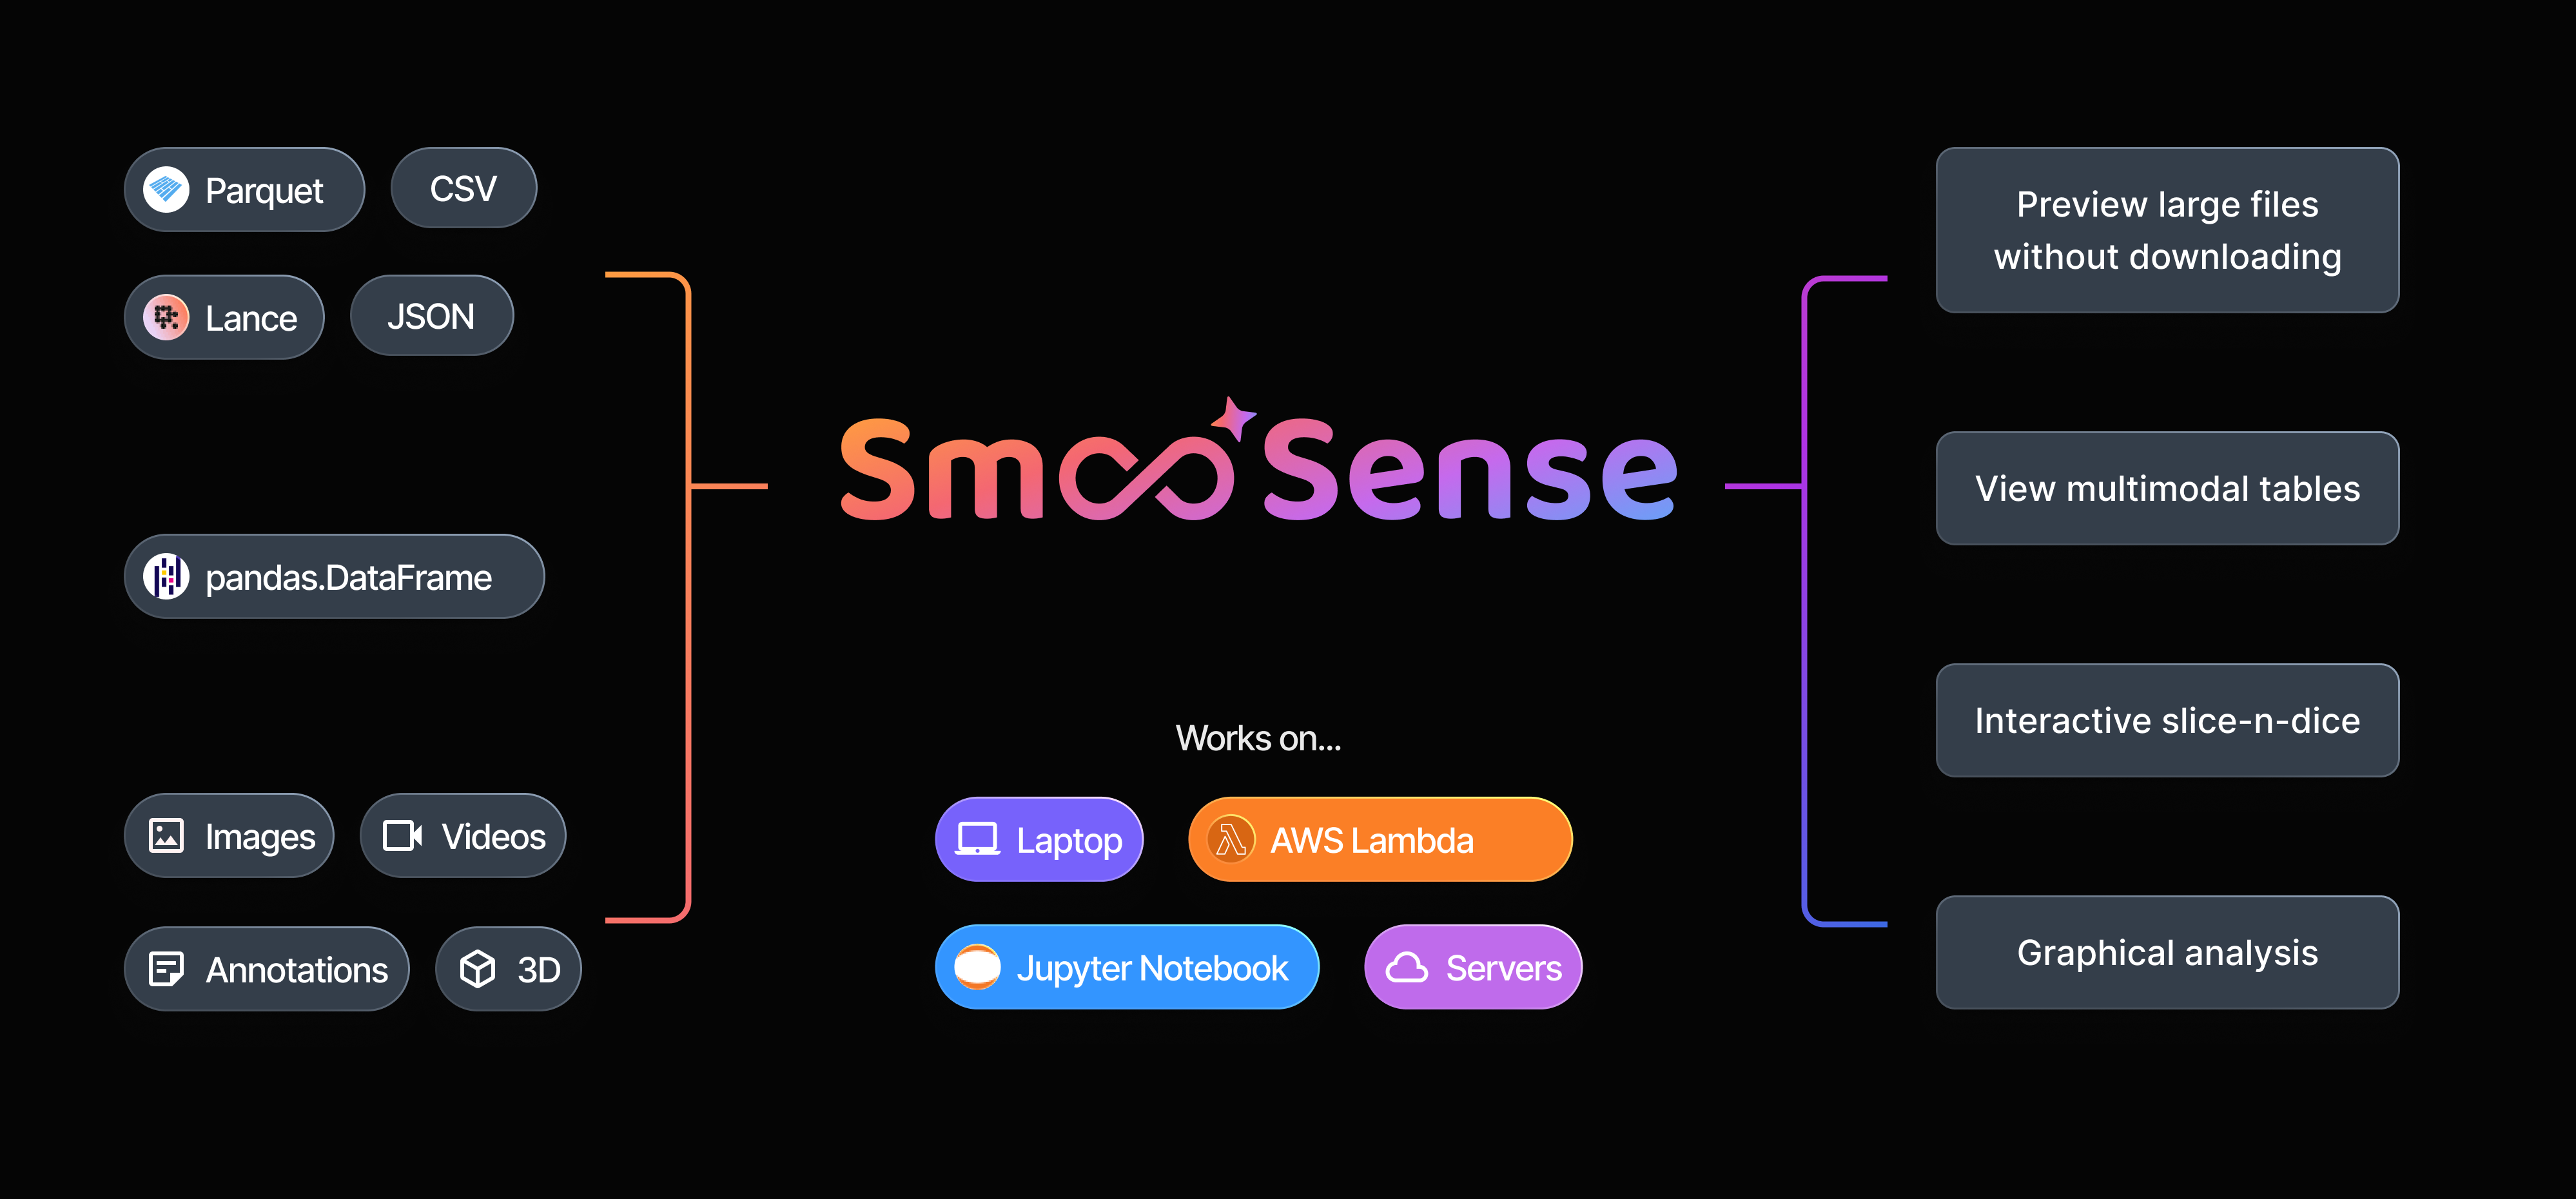
SmooSense works directly on your folders and files (local or S3) for maximum flexibility. It fits seamlessly into your existing workflow, bringing intuitive visual understanding to your data.
Purpose-built for multimodal
Specially optimized for browsing and exploratory analysis of multimodal data.
Clear at a glance. Full details just a click away.
All in one place
Stop juggling between tools. Turn your FolderBrowser, Table and Gallery into visual workspaces.
Built-in support for common modalities
Image along with optional mask and overlaid annotations. Audio with Mel-spectrogram automatically computed. Video, robotics motion, 3d objects, json, pdf etc.
Bring your own visual
Need a custom visualization? Build it your way and embed it as iframes.
Interactive slice-n-dice
Stay in flow: explore distributions, apply filters, and see updates instantly
SmooSense automatically translates your UI actions into optimized SQL, runs queries in parallel, and refreshes plots on the fly.
Effortless SQL
Powered by DuckDB, it runs directly on your data files on your laptop. Slice and dice instantly at anywhere, no query engine, no ingestion.
Clear view of missing data
A dedicated chart highlights missing percentages at a glance, while a separate view keeps the real distribution visible—even when missing values dominate.
Parallel & Scalable
Easily scale to tens of million rows on your laptop. Go billions on the cloud.
Graphical analysis and drill-through
Effortlessly move between big picture and fine details
Explore patterns visually, and one-click to see samples.
Auto drill-through
Single click to see associated samples with visuals.
Flexible plugin
Unique data? Bring in your own visualizer as iframe.
Large scale
Designed to handle 10+ million rows on laptop and billion-row on cloud.
When you should choose SmooSense?
See how we compare to other data analysis solutions
Compare with BI (Business Intelligence) software
Examples: Tableau, Power BI, SuperSet
| Feature | SmooSense | BI software |
|---|---|---|
| Common |
| |
| Data Types | Multimodal native
| Numerical data focus
|
| Coder friendly | Open source SDK
| Primarily manual operations
|
| Customization | Flexible
| Less focused
|
Compare with Voxel51
and other similar computer vision platforms.
| Feature | SmooSense | Voxel51 |
|---|---|---|
| Common |
| |
| Data Types | Broader multimodal
| Vision-focused
|
| Target users | Technical and non-technical
| Engineers
|
| Analysis approach | Table-first
| Image-first
|
| Usage | Flexible, horizontal tool
| Opinionated e2e solution
|
Pricing for every stage
Open Source
Free forever
MacOS app (coming)
CLI
Python SDK
Full analytics features, up to your computer's hardware limit.
Community support via GitHub.
Enterprise
Everything in free tier.
Prioritized generic feature request
Support for integration and deployment.
Tailored solution
Contact us
Everything in enterprise tier.
Tailor-designed for your use cases.
You own the copyright.
VAT may be applicable depending on your location.
Frequently asked questions
- Can I use it for my private data?
- Yes. SmooSense is a pure software that can run in your local network. Your data can be on your laptop, in your on-prem cloud, or VPC, never transferred out.
- Can I use it in my open-source or commercial project?
- Yes. SmooSense is licensed under Apache 2.0, a permissive open source license. You can use it for any purpose, including commercial use, modify it, and deploy it in production.
- Is the full source code available?
- Yes. SmooSense is fully open source under Apache 2.0. Both the Python SDK and the GUI source code will be available on GitHub.
- Do you provide tailored solution for enterprise?
- Yes. Contact us at [email protected]