
Analyze document agent using SmooSense
September 28, 2025
Analyze document agent using SmooSense
1. Structured document#
A structured document is a document whose content is organized into fields, labels, and defined regions rather than free-flowing text. Examples include invoices, tax forms, medical records, receipts, contracts, and ID cards. Unlike plain text, structured documents encode information in a way that combines layout, tables, and key-value pairs, making them valuable for automation.
Here is an example of a structured document. On the left is the document (a tax form), and on the right is the corresponding extracted data. Each field in the form is directly linked to one entry in the data table.
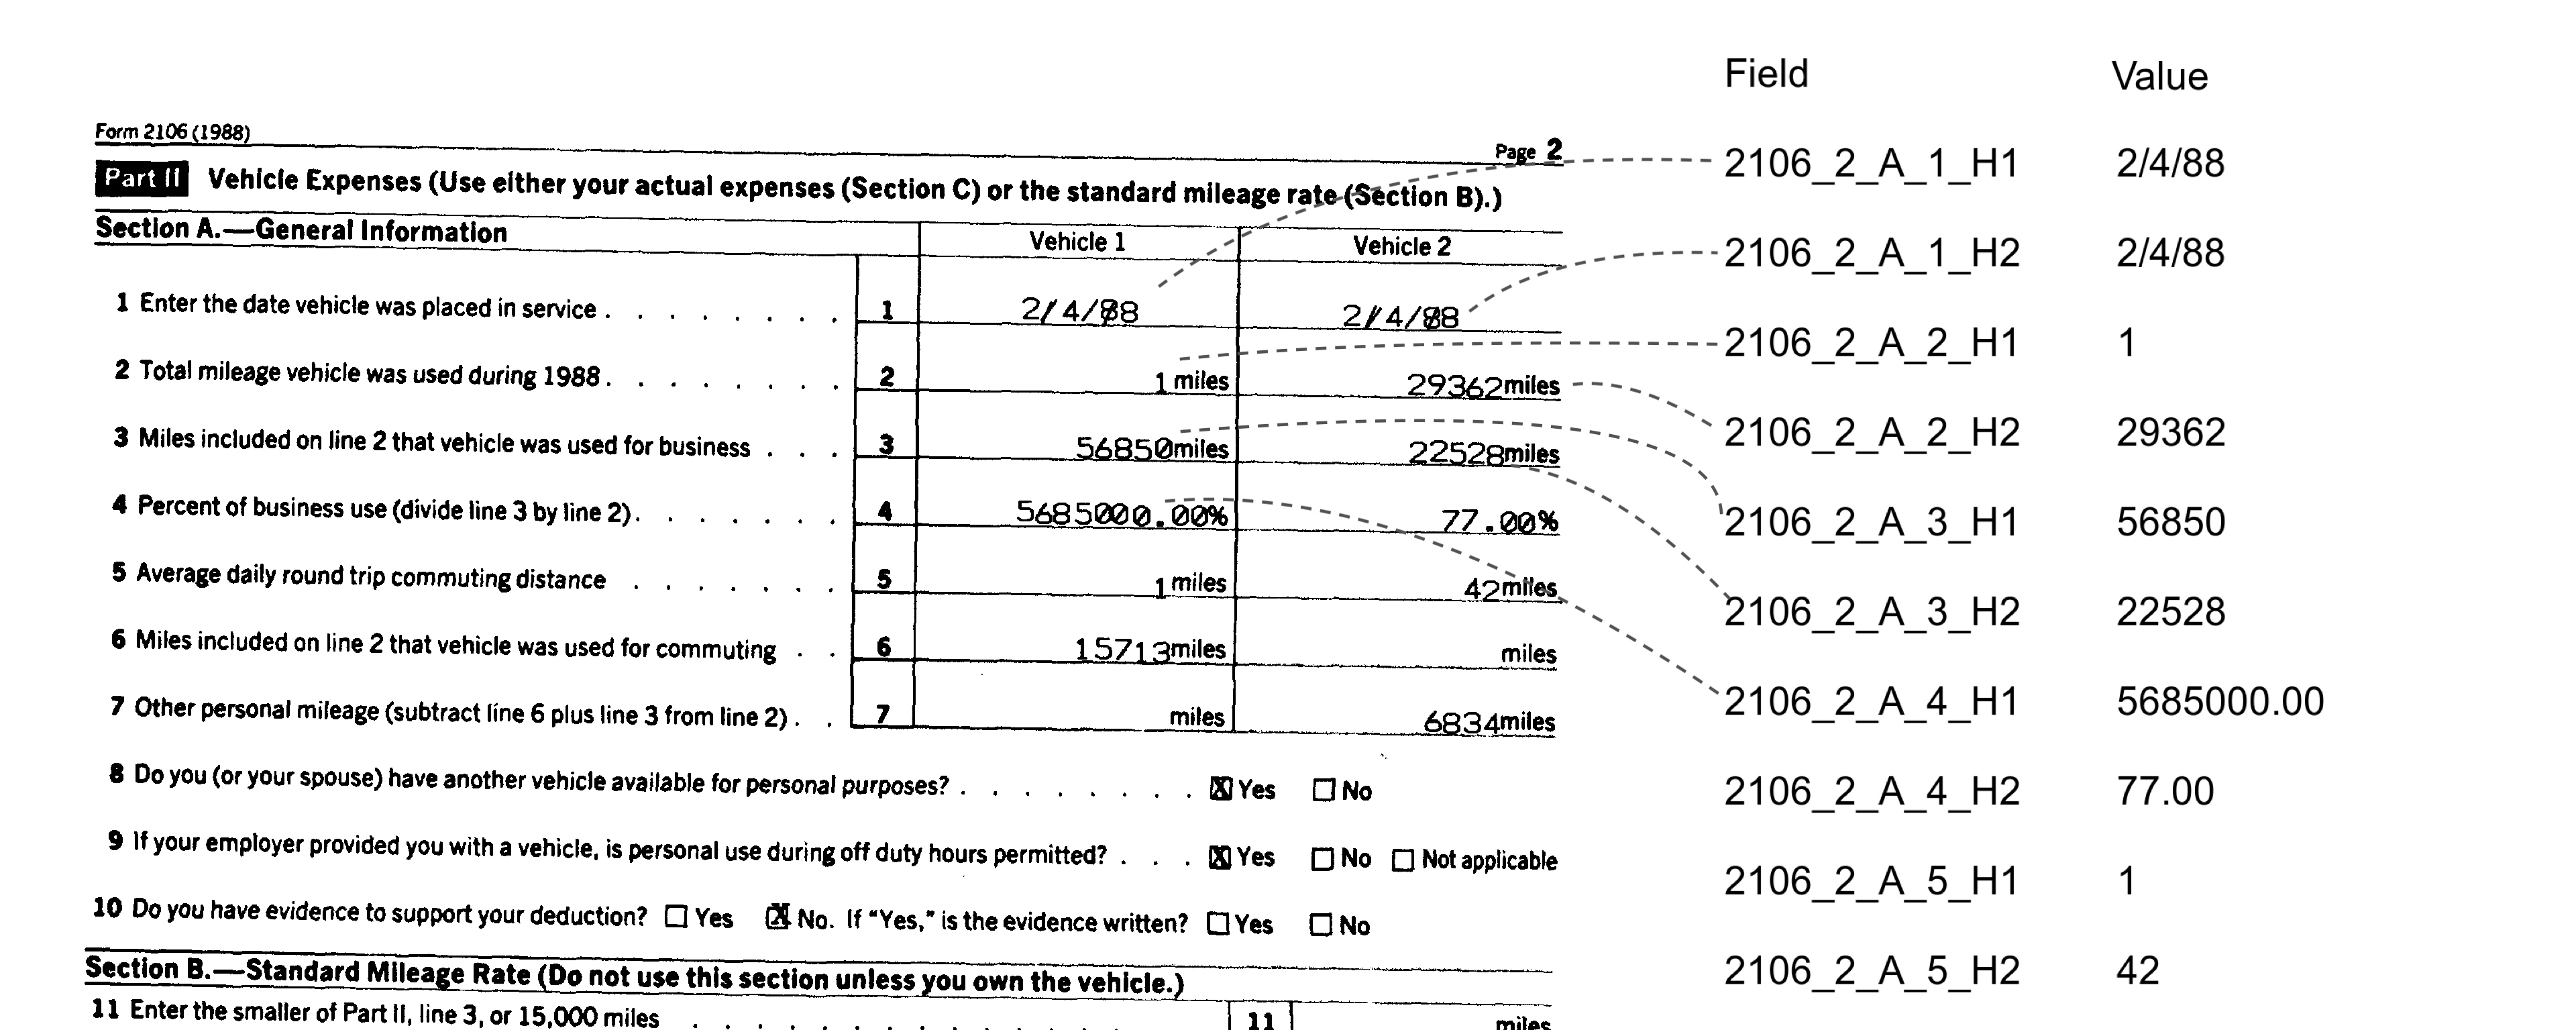
When working with a document and its corresponding data file, it’s often necessary to verify how well the image aligns with the key–value pairs in the data. In this example, you’ll see how SmooSense’s flexible visualization makes that process far easier and more intuitive.
2. Use VLM as a judge#
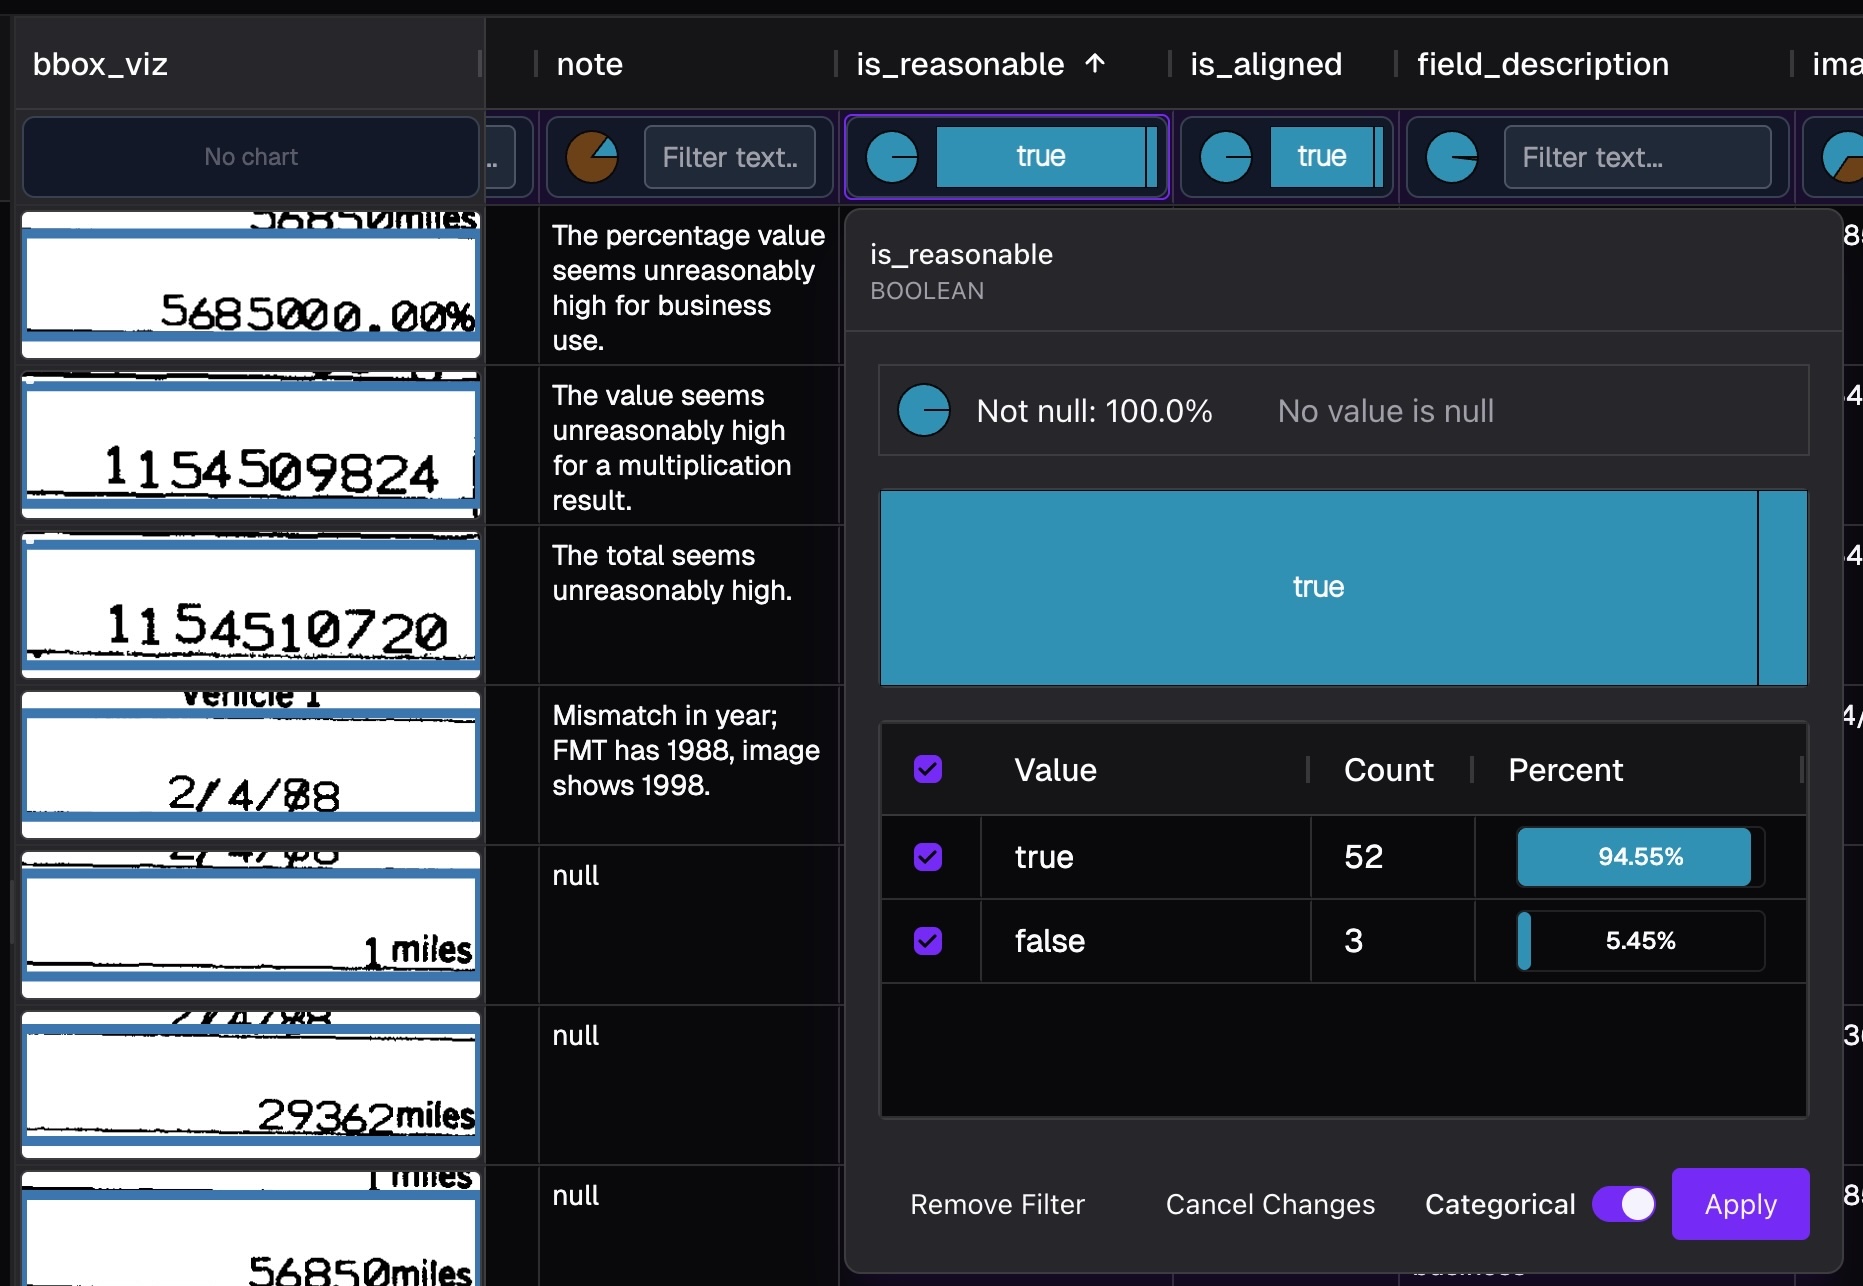
We can use VLM to judge alignment between image and data, as well as reasonableness of data values.
- Input: a pair of tax form image and data key-value pairs
- Output: VLM is instructed to produce these fields for each row in the data table:
is_aligned: True or false, indicating if value in image align with value in data file.is_reasonable: True or false, indicating if the value falls in reasonable range.note: Give explanation if you think it is not aligned or unreasonable.confidence: Value between 0 and 1, indicating if human verification is needed.value_bbox: bounding box of the value in image for convenient human verification.
Then we save VLM response into a table file of all these columns.
3. Build your agents with confidence#
Real-world documents are messy. They can contain mistakes, missing values, or unexpected corner cases. The images themselves are often imperfect too — distorted, over- or under-exposed, crinkled paper, or faded ink. On top of that, LLMs are not always deterministically predictable. To make matters worse, data can arrive in different formats depending on the source, and layouts vary across software and platforms.
So how do you trust the agent you’re building? And more importantly, how do you help your customers trust it?
Humans have long-established ways of building trust. For example, the IRS cannot verify every single tax return, so they require good record-keeping and perform audits on a subset of taxpayers. In the same way, your agent can log intermediate results, and you can analyze those results to gain confidence or identify where the agent needs improvement.
SmooSense makes this process far easier with intuitive visualization and analysis tools:
- Display visuals alongside extracted text values, making comparison and verification straightforward.
- Surface the samples that deserve attention (out of millions), based on conditions such as low confidence.
- you discover new corner cases, seamlessly add them into your evaluation datasets to strengthen future performance.
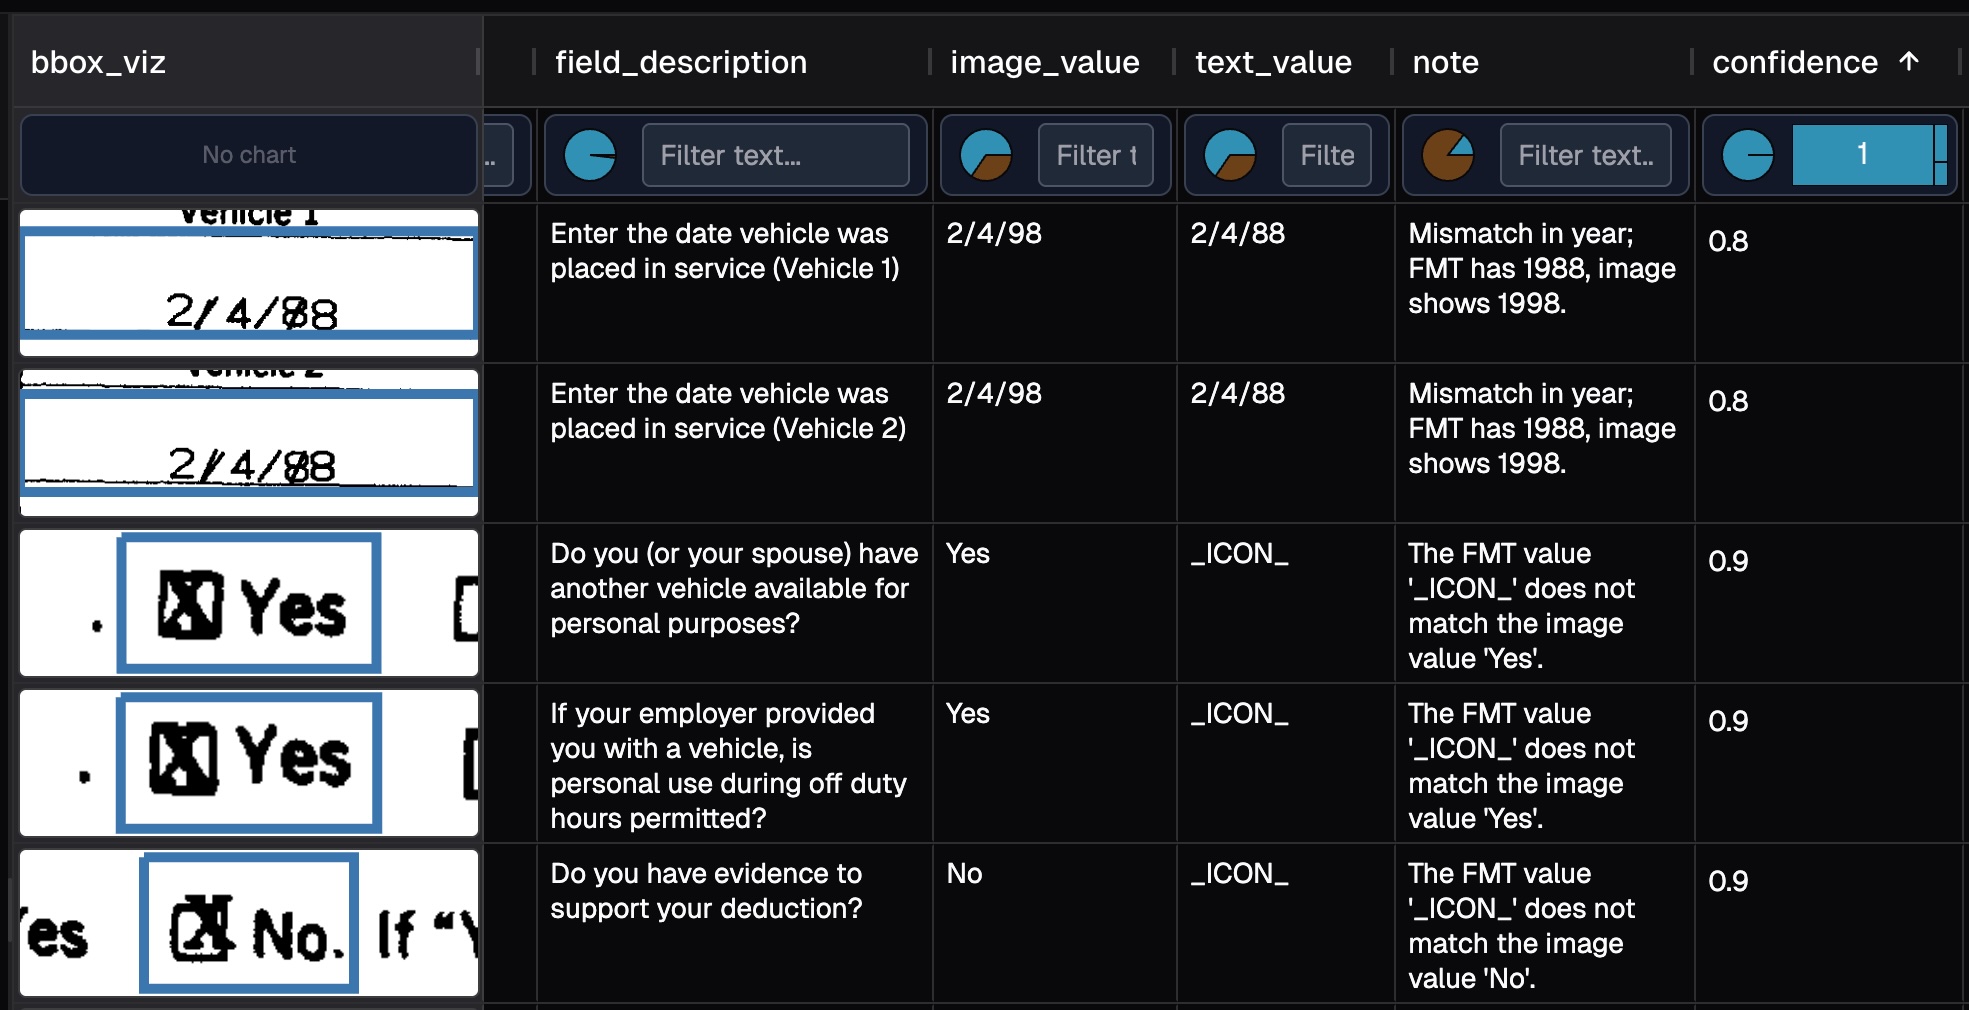
In the image above, it is showing samples sorted by confidence ascendingly.
4. Find root cause with integrated visualization#
4.1 Use LLM to identify unreasonable values#
Today, even off-the-shelf AI can deliver solid results, but pushing performance from “good” (around 80) to “excellent” (95 and beyond) requires exceptional attention to data quality and pipeline details. In this example, we ask the AI to go a step further — not just extract values, but also flag numbers that are unreasonable given the tax context and the meaning of each field.
4.2 Integrated visualization#
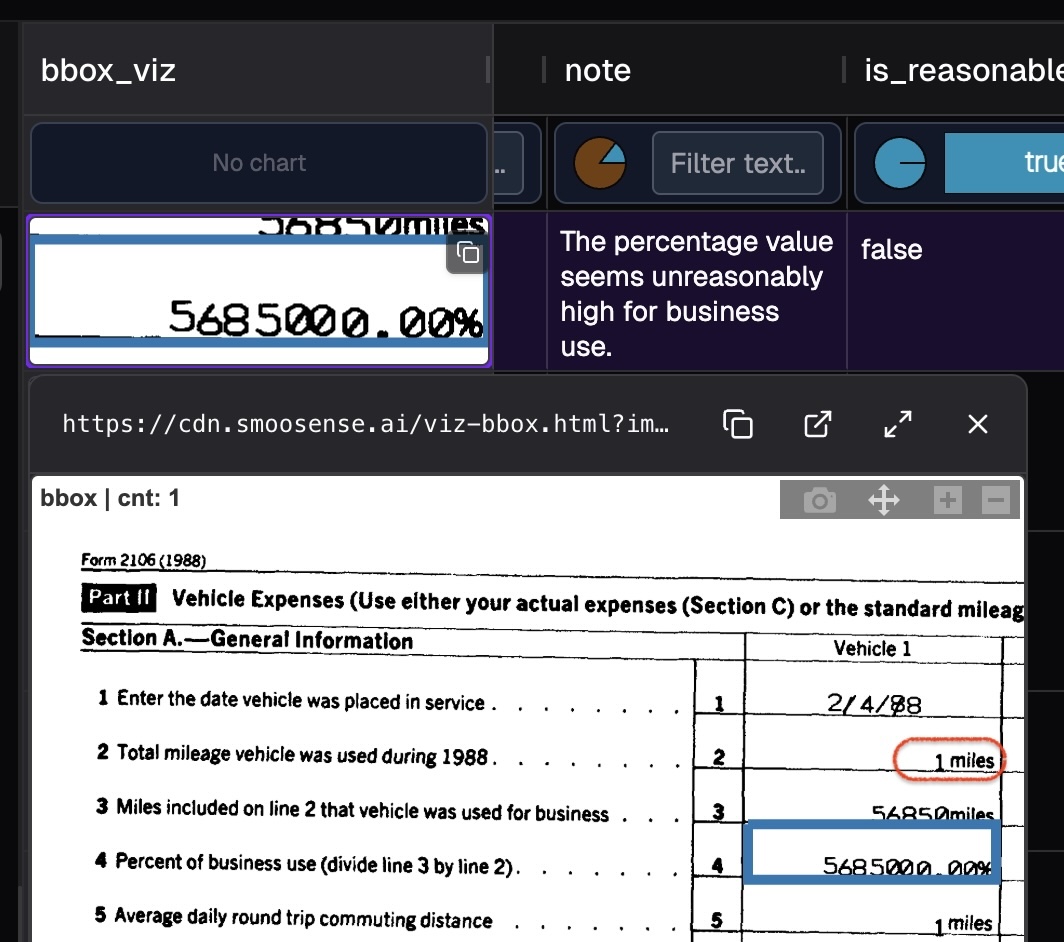
GPT-4o quickly spotted an anomaly: 5685000.00% is clearly an unreasonably large percentage.
While that’s not the root cause, the real issue is often close by.
By clicking on the bounding box visualization, you can open an interactive view like image below.
Zooming out slightly reveals the problem — the total mileage was mistakenly recorded as just 1 mile.
What’s next? It depends on your goal:
- If your job is to review documents: let AI handle the 80% of straightforward cases, so you can focus your attention on the tricky edge cases.
- If your goal is to build a robust agent: add this data point to your training or evaluation set, and ensure your agent consistently passes this test before every future release.
4.3 Why it is so important to have zero-friction visualization?#
Because raw numbers rarely tell the whole story. A model’s output might show you the symptom (like 5685000.00%), but only by seeing it in context can you trace back to the cause (a mistaken 1 mile entry).
Without integrated visualization, debugging becomes a tedious loop of exporting logs, re-querying data, and manually cross-referencing documents. Every extra click means fewer issues spotted and slower iteration.
With zero-friction visualization:
- Speed multiplies — you can jump from anomaly → context → root cause in seconds.
- Trust builds — teams see with their own eyes why the AI flagged something, rather than treating it as a black box.
- Feedback loops tighten — every identified error can be turned into a training or evaluation example, directly improving the next release.
5. SmooSense for pioneering teams#
SmooSense is a lightweight tool that works directly on your data files. This means:
- Versatile: Use it for dataset curation, failure analysis, model debugging, and more.
- Effortless to start: Simply export your data as a file and begin exploring.
- Highly flexible: No infrastructure or ingestion required — easily adapt schemas and iterate workflows.
- Seamlessly integrable: Works with any platform that can expose data as files.
We are at the dawn of a new AI era, where iteration speed is critical for pioneering teams. SmooSense lets you explore data with unprecedented ease and productivity — accelerating both insight and innovation.