
Exploratory Data Analysis
Exploratory data analysis (EDA) for multimodal data
Exploring your data shouldn't feel like work. SmooSense turns EDA into a smooth, visual experience — instantly showing distributions, patterns, and anomalies across all your tables, images, and embeddings. No setup, no scripts, no context-switching. Just open your dataset and start seeing what matters.
When exploration is effortless, insight comes naturally. SmooSense removes friction so you can follow your curiosity. It’s the fastest way to build an accurate mental model of your data.
Whether you’re debugging a model, preparing a dataset, or just trying to understand what you have, SmooSense gives you clarity at a glance. Clean design, instant feedback, and intelligent visualizations let you get answers without wrestling with tools. Explore more, understand deeper, and make better decisions — effortlessly.
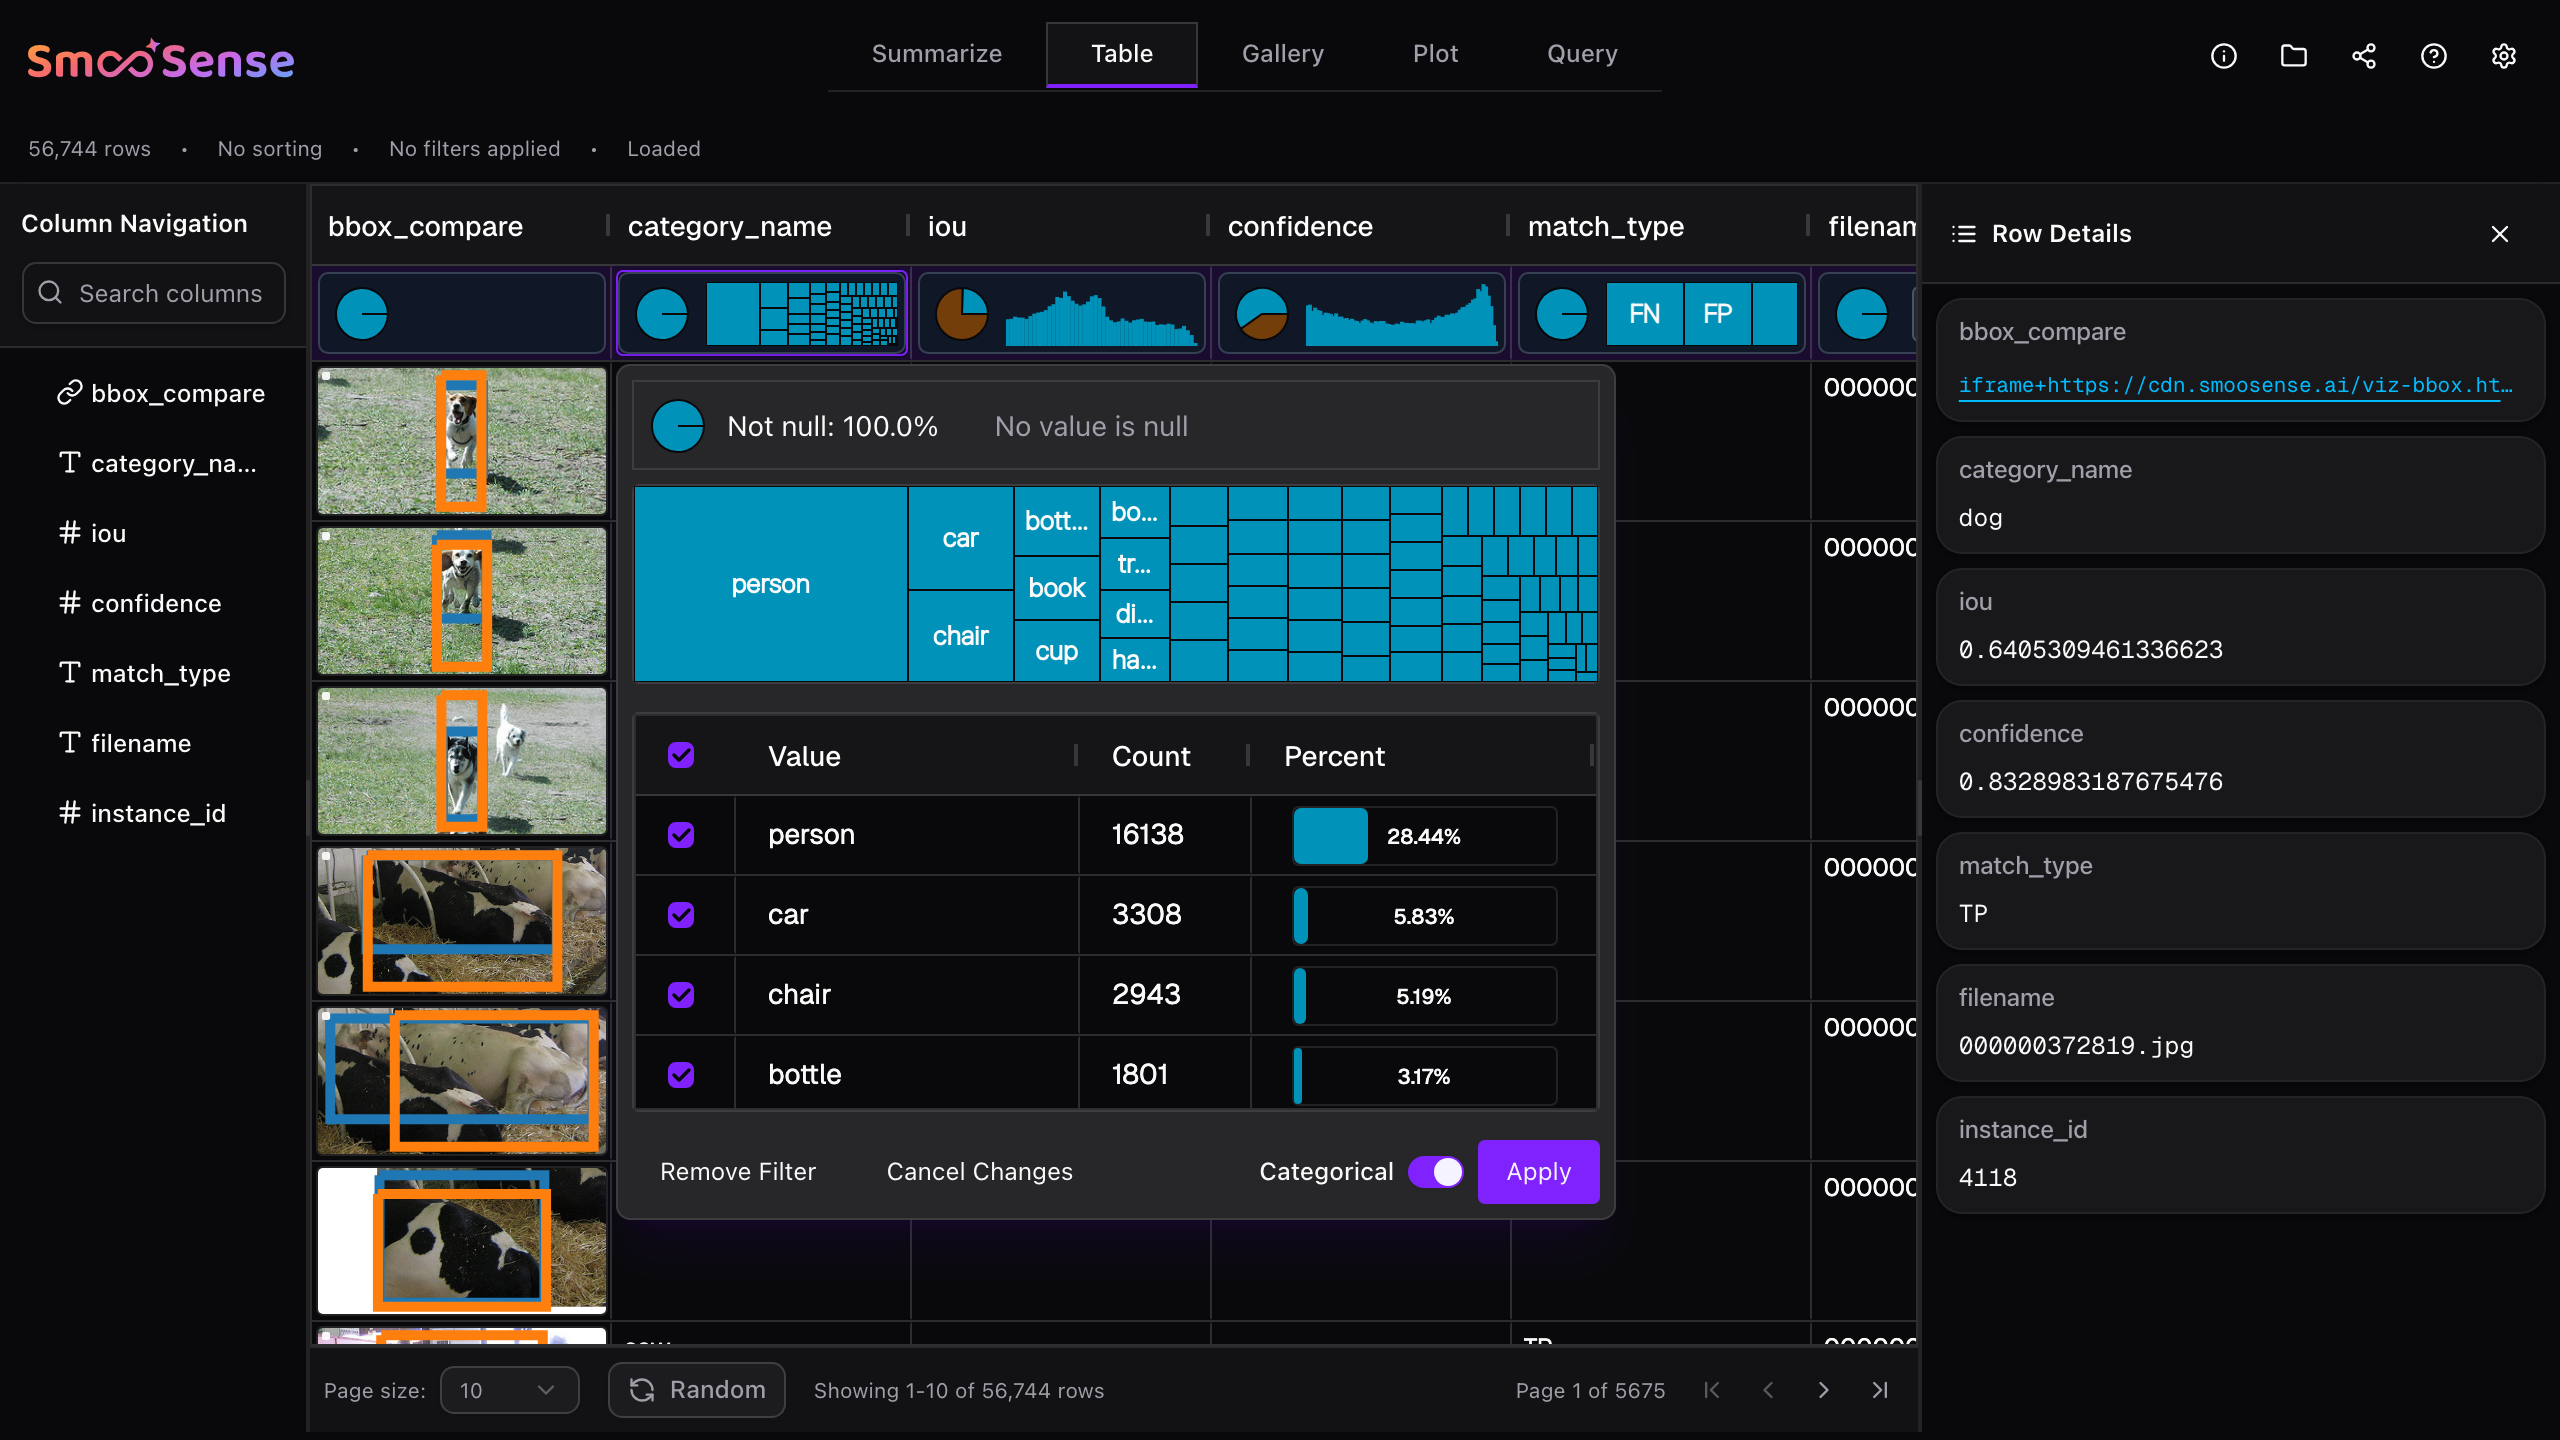
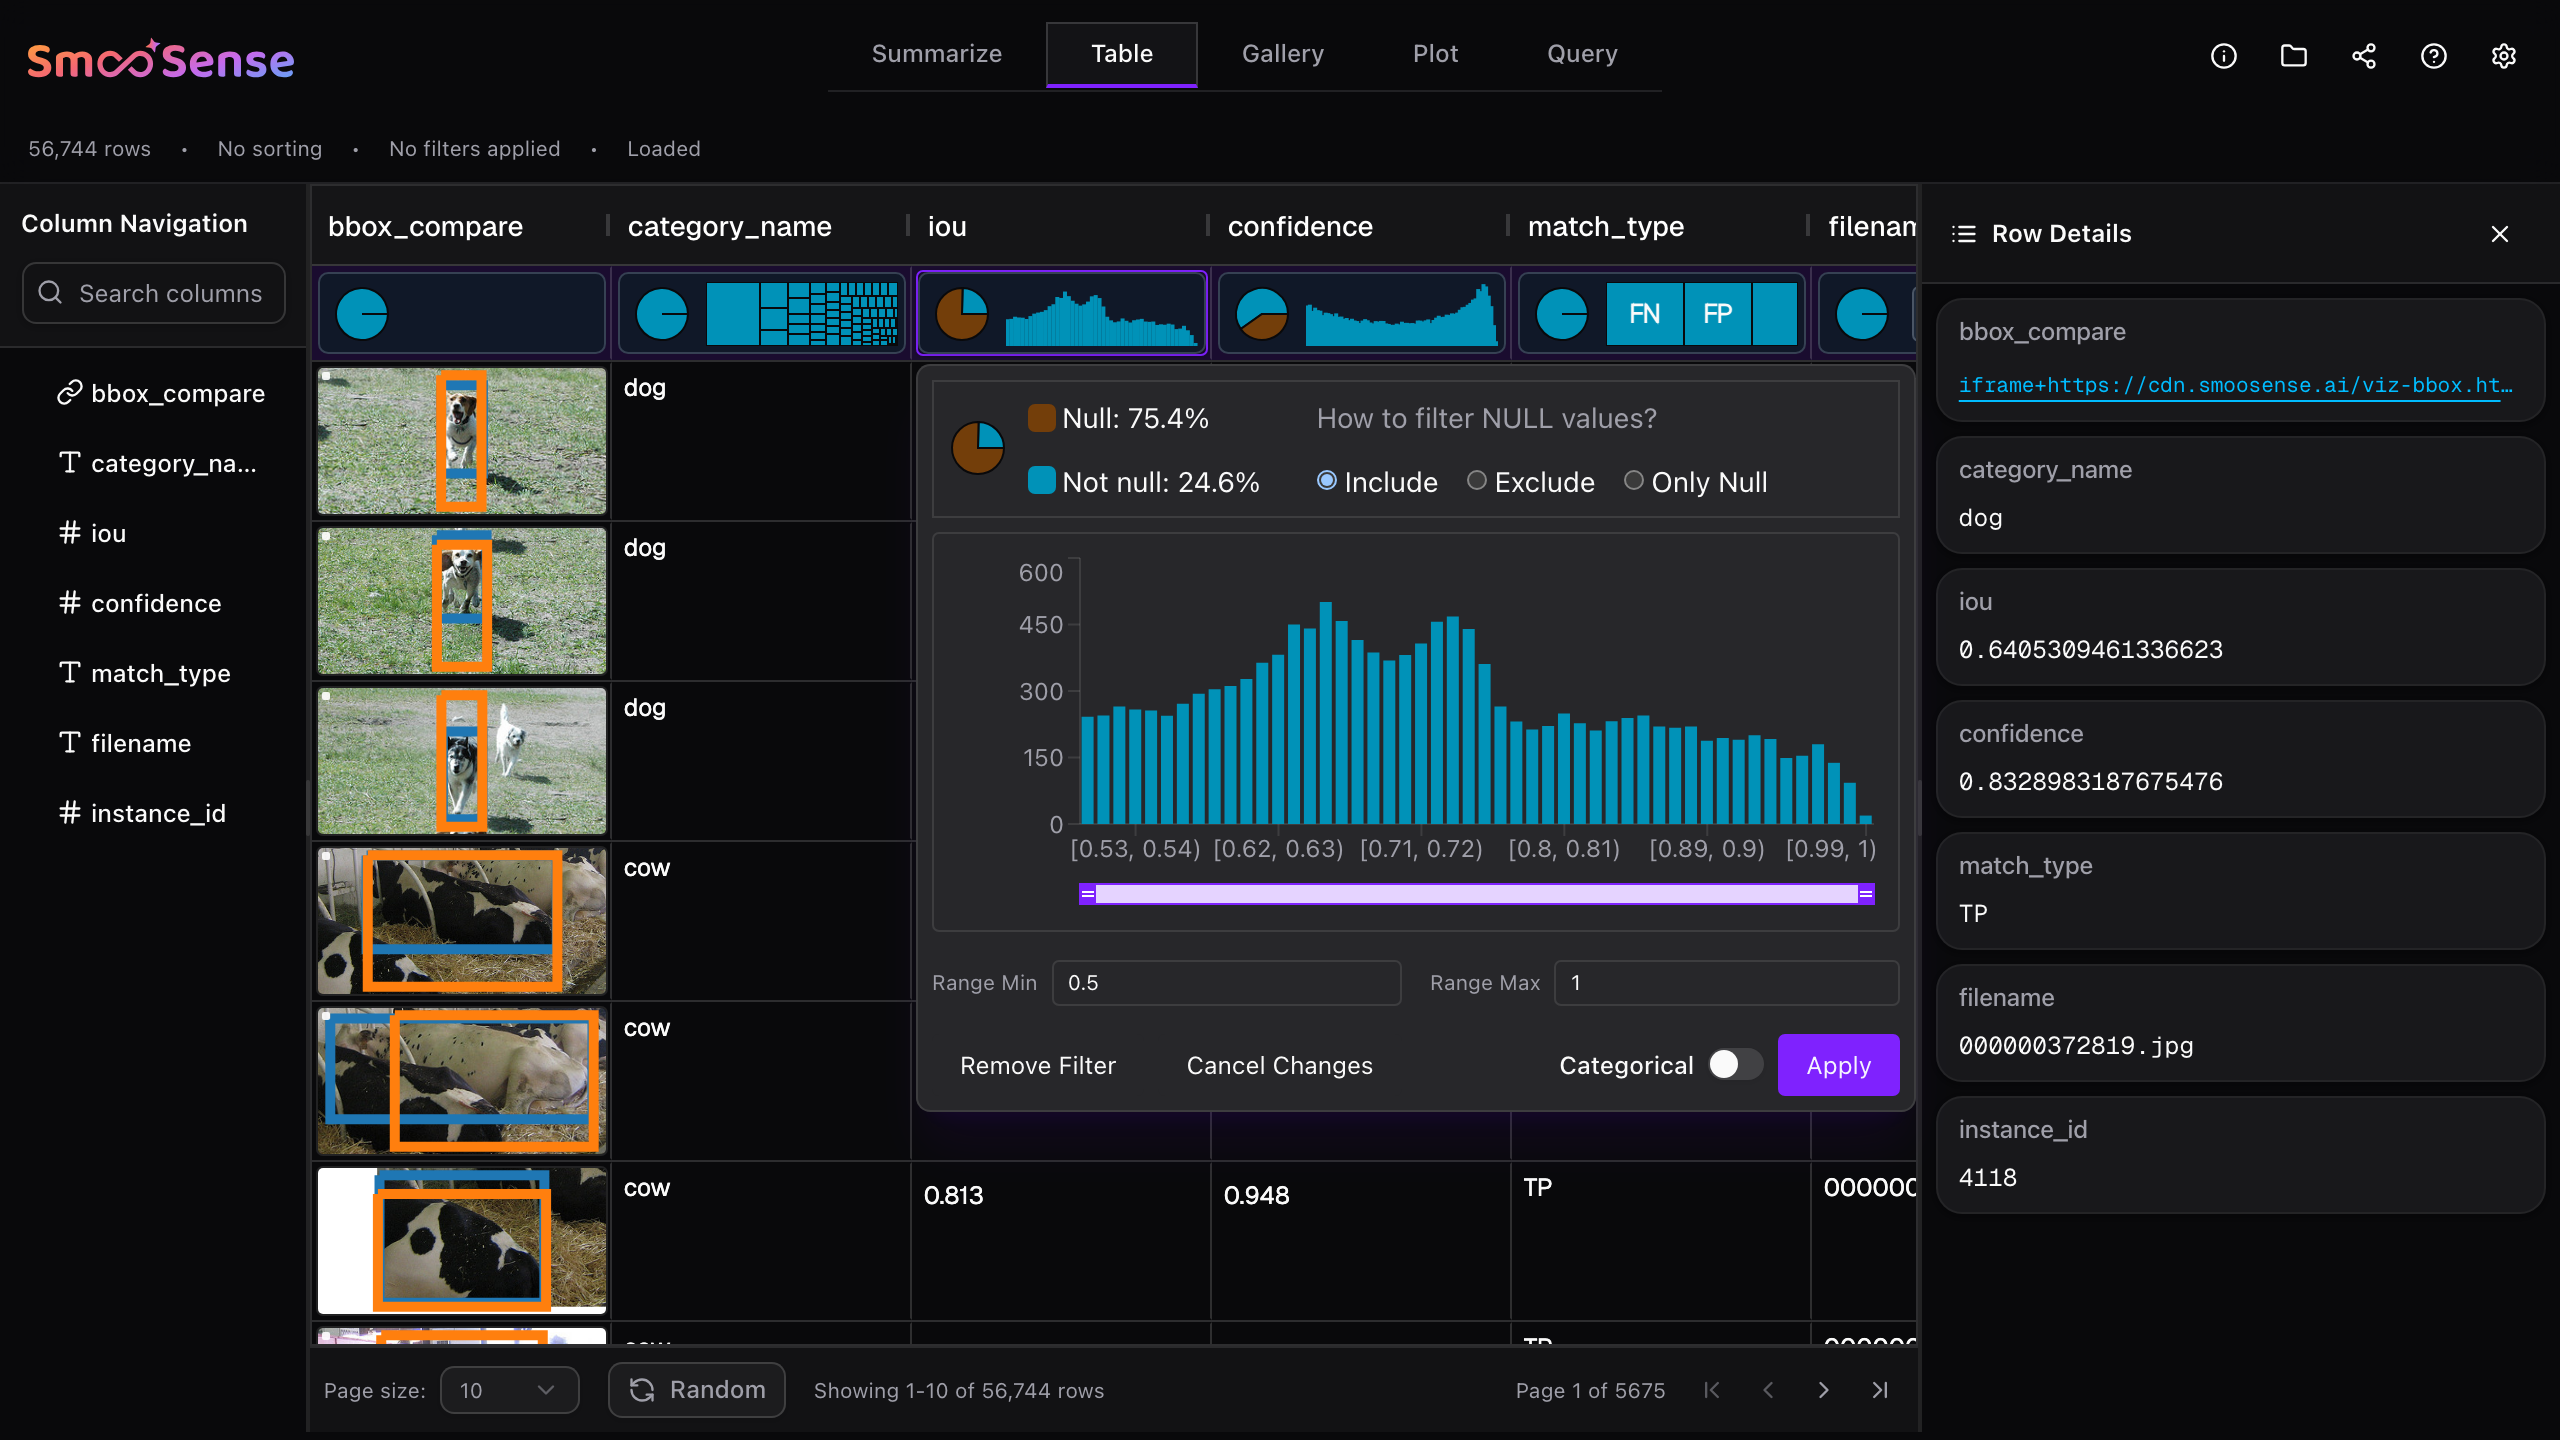
1. Mini plots of distributions#
SmooSense automatically computes and visualizes the distribution of each column directly within the column headers. These mini-plots are designed to convey key statistical insights at a glance — without overwhelming you.
Some examples:
- The pie chart indicates percentage of null values vs non-null values.
 has roughly 75% null values
 does not have null value.
- The distribution plots depend on data type.
- is categorical,
- is numerical.
- Both categorical
 has very high cardinality.
 has higher cardinality
- has 3 distinct values.
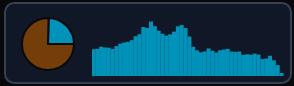
- Both numerical,
- has a distribution around the center.
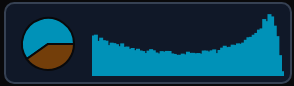 has two peaks.
2. Look into details and interactively slice-n-dice#
Need more detail? Just click any header plot to open a full, interactive visualization. From there, you can slice and dice your data directly on the chart—apply a filter, and watch every other column instantly reshape its distribution based on your selection. It’s an effortless way to explore your data from multiple angles.
3. Summarize distributions of all columns#
People inspect column distributions whenever they need to trust their data, understand its shape, or make informed decisions. It’s a universal step across analytics, ML, science, finance, and operations.
The Summarize tab in SmooSense is built exactly for this workflow:
- Automatically computes and visualizes the distribution of every column, with one-click access to deeper details.
- Shows the percentage of non-null values—crucial for assessing data completeness.
- Displays key stats like approximate distinct counts, min/max values, for quick sanity checks.
The best part is that all distributions update instantly based on your filters. Once you narrow the dataset to a subset of interest, SmooSense recomputes and shows the conditional distributions in real time, helping you understand patterns, anomalies, and relationships at a glance.
4. Visual analytics#
Visual analytics combines human intuition with computational power, creating an analysis style that is fast, intuitive, and highly exploratory. SmooSense makes this effortless for multimodal data. With SmooSense, you can spot patterns you’d never notice in tables, catch data-quality issues before they become expensive problems, reduce cognitive load, and dramatically accelerate decision-making.
Bubble plots are ideal when you want to grasp the shape and structure of extremely large datasets at a glance. Nearby data points are grouped into compact “bubbles,” where each bubble represents a local cluster and its size reflects data density. This reveals high-level patterns—clusters, outliers, imbalances—without overwhelming your screen.
And unlike vibe-coded tools, SmooSense's bubble plot is engineered for scale. It can smoothly visualize hundreds of millions of rows, making it perfect for exploring embeddings or any pair of high-volume columns.
SmooSense also adds automatic drill-through for deeper exploration. When you spot an interesting region, just draw a selection around it. SmooSense will fetch a representative random sample from that cluster and instantly show you the underlying visuals (images, videos, metadata, or any multimodal preview).