
Visual and interactive table in Jupyter Notebook
September 29, 2025
Visual and interactive table in Jupyter Notebook
1. The Limits of Jupyter's Preview#
When you work with dataframe, you often want to quick take a look at its content.
In Jupyter notebook, run df.head(), and then you get a neat little preview of your data.
That’s perfect if your columns are mostly numbers, strings, or dates.
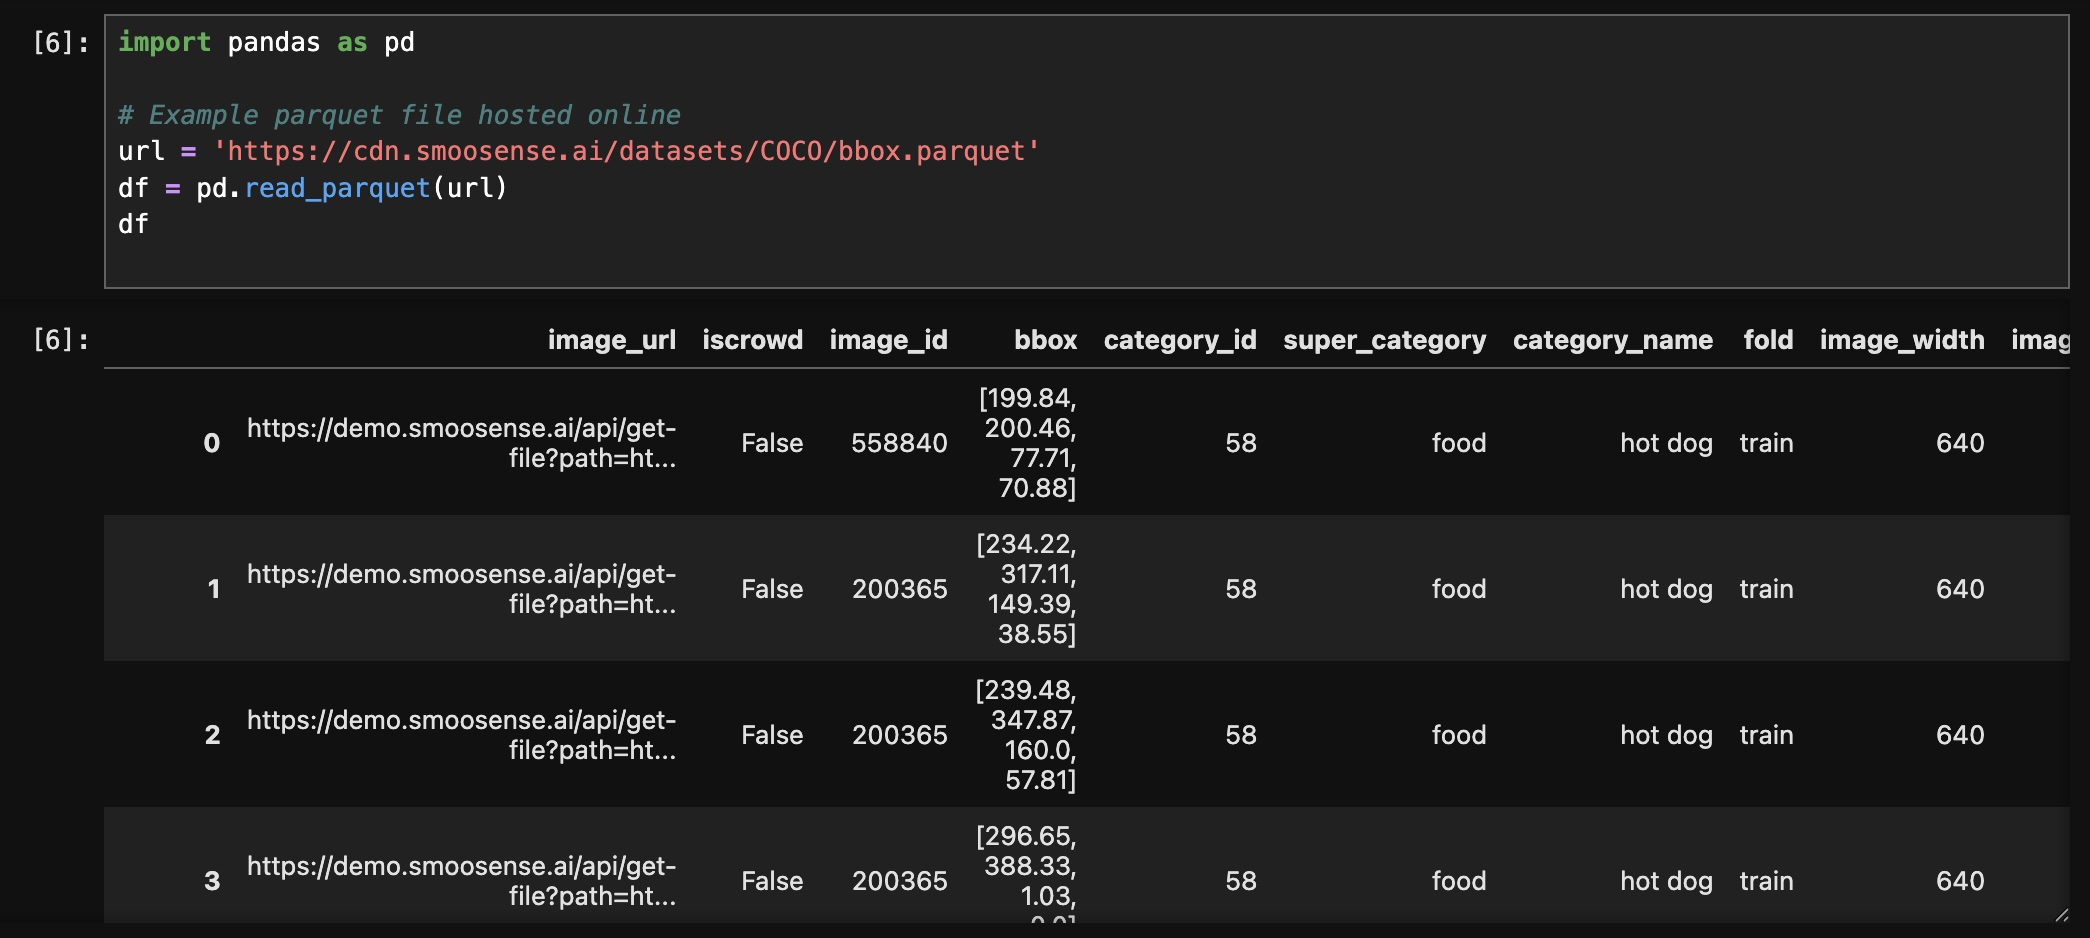
But what if your dataset isn’t just numbers and text? What if it contains images, bounding boxes, annotations, or even video clips? Suddenly, Jupyter’s preview becomes almost useless. Rows collapse into unreadable blobs, and you end up writing custom visualization code just to answer basic questions.
In today’s AI workflows, where multimodal data is the norm, that kind of friction slows you down.
2. Introducing SmooSense#
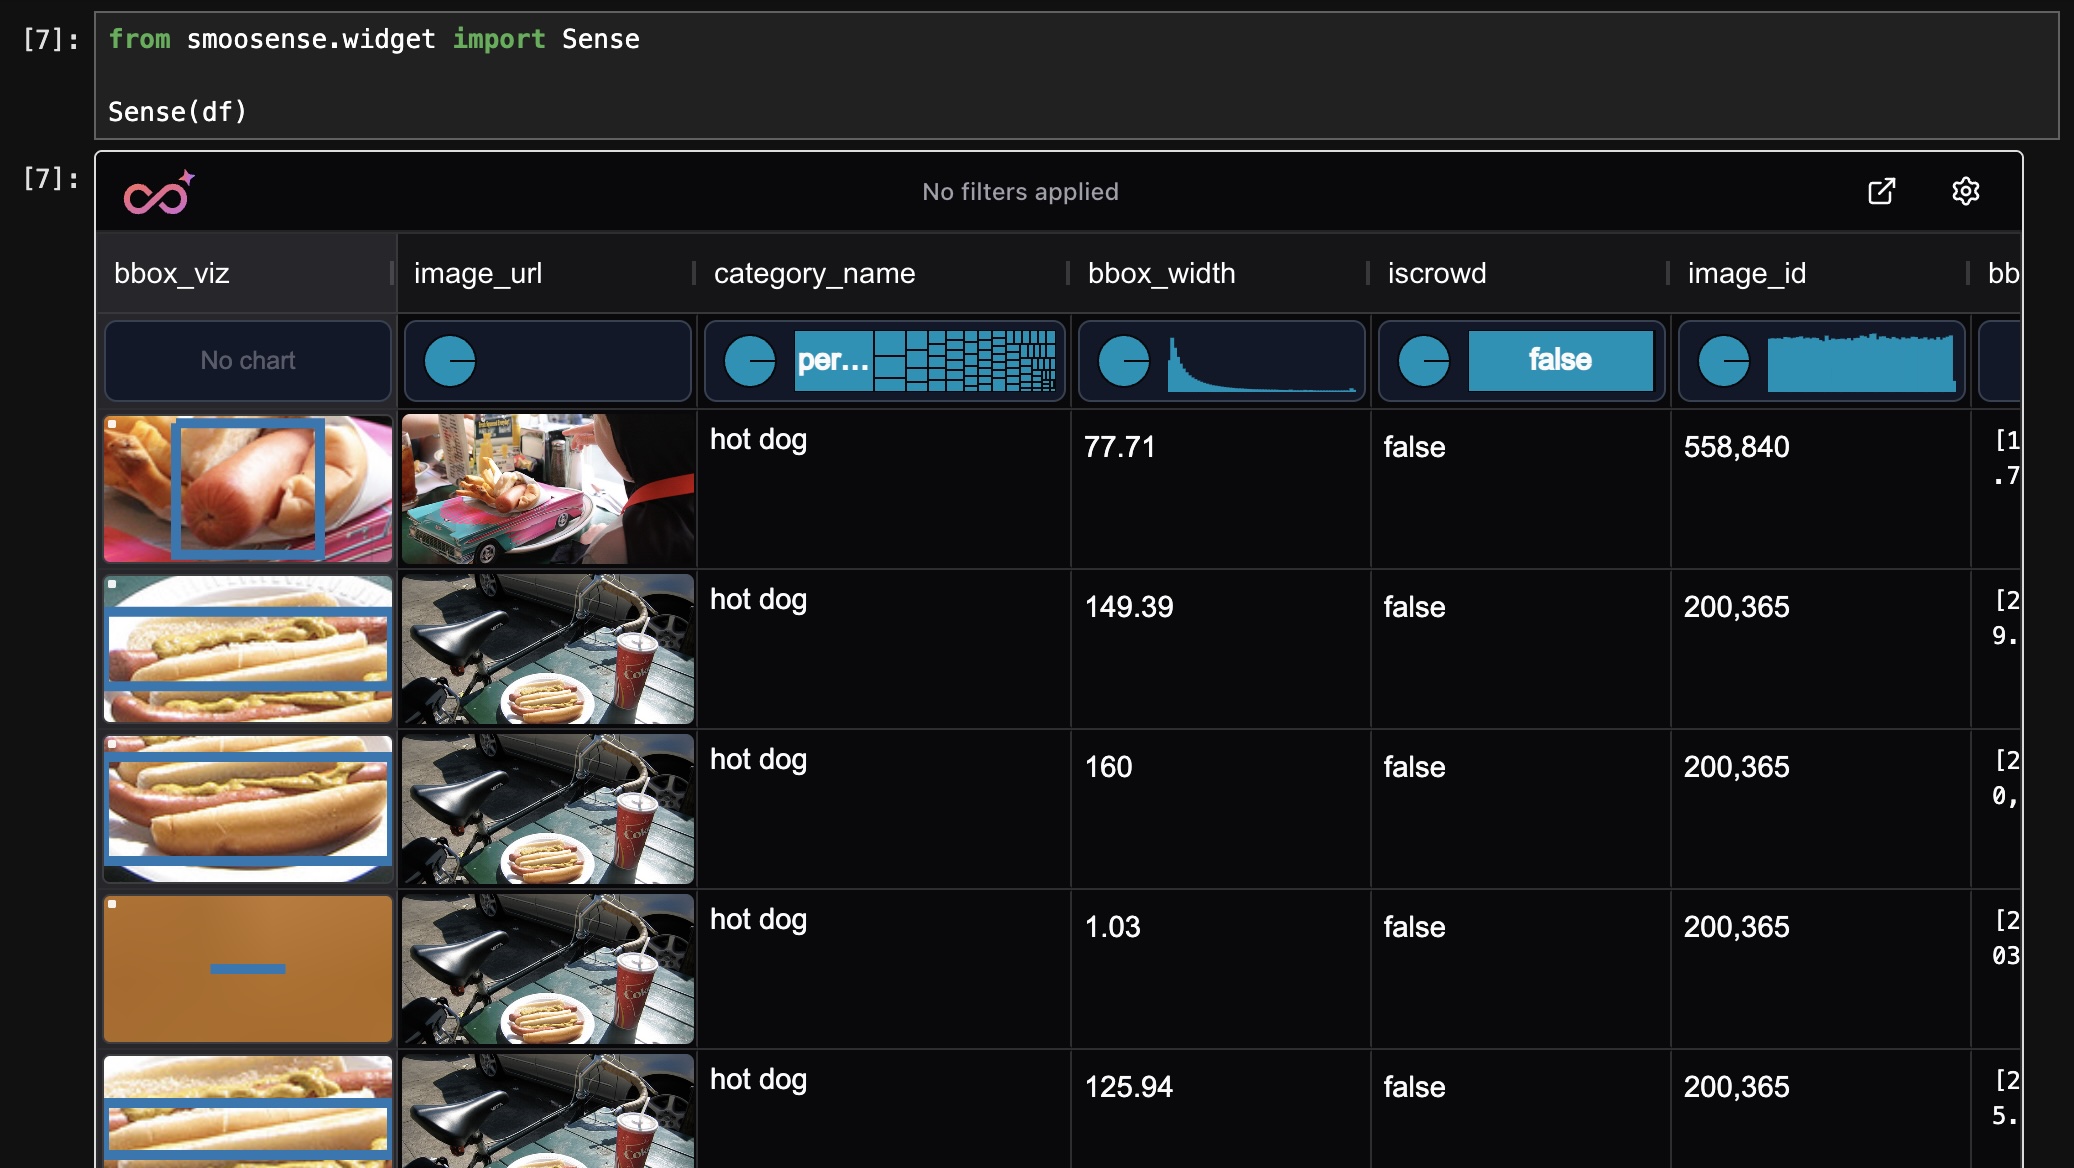
SmooSense is designed to solve exactly this problem. It turns your DataFrame into an interactive multimodal table that lives right inside your Jupyter notebook.
Instead of staring at filenames, hashes, or JSON blobs, you see the actual images, bounding boxes, masks, and video previews — all inline and all interactive.
With SmooSense, you don’t just "look at rows." You explore data visually and interactively, the way it was meant to be.
3. Core Features#
3.1 🔹 Multimodal Table View#
- Native previews for images, videos, bounding boxes, and annotations.
- Rich interactivity that feels natural — click to expand, hover for details, drag to select.
3.2 🔹 Interactive Slice and Dice#
- Apply filters and instantly see the table update.
- Explore sample values without writing boilerplate code.
- Drill down to the exact rows you care about in seconds.
3.3 🔹 Instant Distributions#
- Quickly inspect distributions of categorical or numeric fields.
- Identify imbalances or outliers without exporting data to another tool.
4. Going Beyond the table#
Sometimes you need more screen space and more power. SmooSense makes that easy too.
Open the DataFrame in a dedicated tab view and unlock richer analysis capabilities:
- Bubble plots to explore embeddings or clusters.
- Heat maps, box plots, and histograms to compare distributions.
- Drill-through on every plot: click on a data point and jump straight to the underlying samples.
This means you can move seamlessly from big-picture statistics to individual examples with a single click.
5. Why It Matters#
Modern AI teams live and die by their data. Model improvements often come not from tweaking architectures, but from better data curation, failure analysis, and debugging.
But here’s the catch: the faster you can explore your data, the faster you can iterate. And iteration speed is everything when you’re training and evaluating models.
That’s why we built SmooSense — to make data exploration 10× easier, faster, and more intuitive. Instead of spending hours hacking together custom Python or SQL scripts, you get instant, interactive insights with zero setup.
6. Final Thoughts#
We’re at the dawn of a new AI era. Data isn’t just numbers in spreadsheets anymore — it’s multimodal, messy, and high dimensional. Tools that treat data as just rows and columns won’t cut it.
SmooSense gives you a new lens: one where multimodal data becomes visual, intuitive, and interactive. Whether you’re curating datasets, debugging failures, or analyzing model regressions, SmooSense puts your data at your fingertips.
So next time you load a DataFrame, don’t just head() it. SmooSense it.
Visit us at https://smoosense.ai
7. Get started#
It is very easy to get started:
- Install smoosense
pip install -U "smoosense[jupyter]"- Try with this example
import pandas as pd

# Example parquet file hosted online
url = 'https://cdn.smoosense.ai/datasets/COCO/bbox.parquet'
df = pd.read_parquet(url)

from smoosense.widget import Sense

Sense(df)